Supplementary
material to the paper
Dynamic
Effects Increasing Network Vulnerability to Cascading Failures
By Ingve
Simonsen, Lubos Buzna, Karsten Peters, Stefan
Bornholdt, and Dirk Helbing
e-print: arxiv.org/pdf/0704.1952
![]()
1. Similarities of our model with realistic
electrical simulation models
In this section we present the line flows
obtained by our model and compare them with some available results obtained by very
detailed and realistic AC-simulators of electrical grid. The compared
simulation models share the same scenario, i.e. initially one line is removed from
the network, and the figure shows the flow on a remaining line in the system.
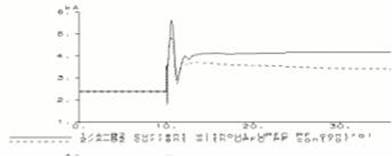
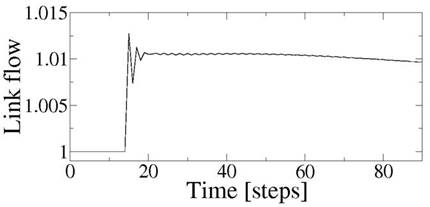
Figure 1: The top figure shows the simulation of
electrical currents in a power line with the EUROSTAG tool. The initial failure
was caused by a disconnected power line [1]. The bottom figure shows similar link flows reproduced by our model.
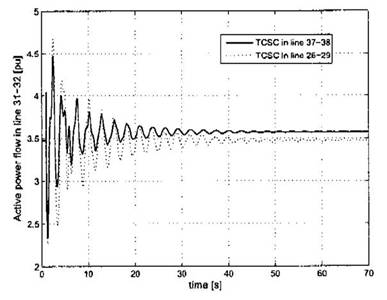
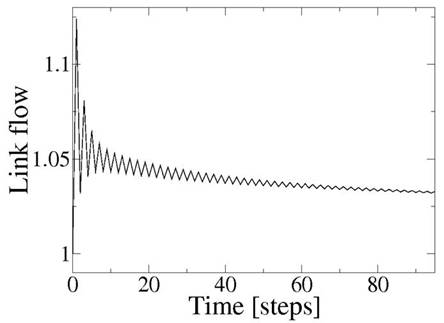
Figure 2: The top figure shows the simulation
power of currents in a power line with the model of Sadikovic [2].
The bottom figure shows similar link flows
reproduced by our model.
1. Example of a real cascading event in
electrical power grids
To support our model, we give
the example of a cascading blackout which very quickly spread across the
European electrical grid on November 4th, 2006 [3]. The initial situation before the blackout is
shown in Figure 3. Four power lines were switched off for maintenance and line
2 was switched off for the transfer of a ship by Meyer-Werft what triggered the
cascade of events.
Figure 3: The situation of the power grid in Northern
Germany shortly before the incident. Lines 1 – 4 were switched off for
maintenance, while line 5 was temporarily switched off for a ship transfer
[3].
After switching off the power
line for transfer of a huge ship, a massive cascade of disconnecting lines spread
in the European power grid. Figure 4 shows fast sequence of disconnected power
lines. The incident affected the large parts of Europe. The affected areas are
depicted in Figure 5.
Figure 4: Shortly after the line was switched off
for the ship transfer, the overall situation in the power grid resulted in a
cascade of disconnecting lines. The time information left of the figure
demonstrates, how fast the cascade propagated in this case.
Figure 5: The incident on November 4th,
2006 resulted in failures across large parts of the continental European
electricity grid [4].
References:
1. http://wwweurostag.epfl.ch/users_club/newsletter/nl8.html
.
2. R.
Sadikovic: Use of FACT devices for power flow control and damping of oscillations
in power systems, (PhD thesis, ETH Zurich), 2006.
3. Report
on the system incident of November 4th, 2006. E.ON Netz.GmbH (http://www.eon.com).
4. E.
Liuf: Critical Infrastructure protection, R&D view, EU project IRRIIS - Internal
document available upon the request.